
The power of video: a story in two charts
Our audio podcast has grown steadily.
The chart above shows time spent listening to the show since it launched in March 2020. This only includes Apple and Spotify, but that’s a good, representative sample.
As you can see, we see steady growth week-to-week and month-to-month.
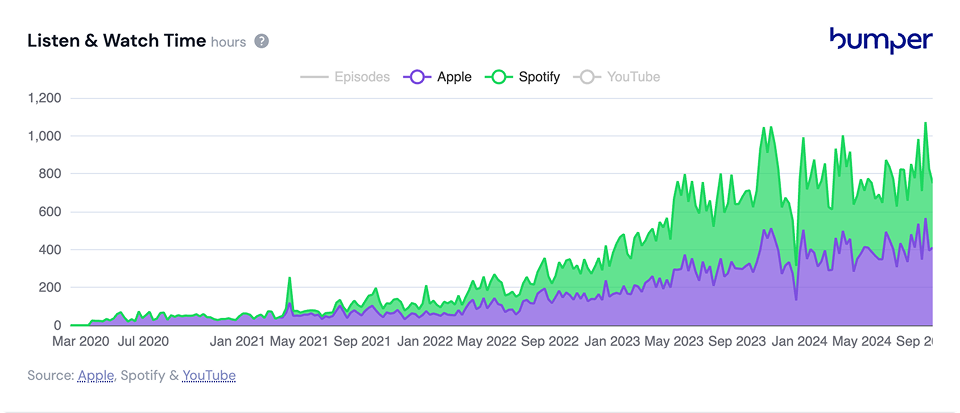
It’s a healthy podcast!
But look what happens when we introduce the watch time of our YouTube channel (which launched in July 2022) to the SAME chart…
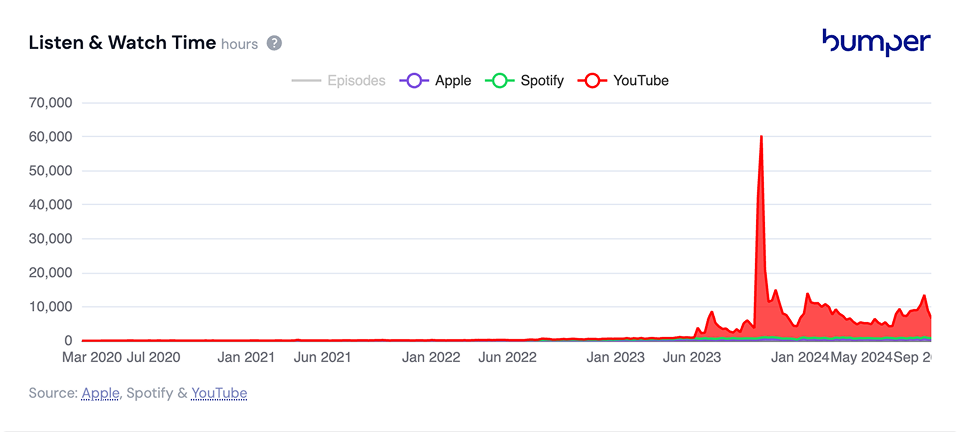
That's 10x more viewers than listeners
Spotify and Apple consumption are still shown in the graph above; they’re just dwarfed by the success of our YouTube channel. That success started in June 2023 (a year into the channel) when we fundamentally changed our approach.
Since then, we’ve consistently generated 10x more video consumption than audio, peaking at 37x more watch time in October 2023.
Our podcast has ~2 million downloads in four years, while our YouTube channel has generated more than 5 million views in just over two.
These are the results we were looking for and the strategy is what we will teach you in this masterclass.
